Test2Fail Toolkit
Test-to-failure data in, a reliability report out.
Which life model fits, how sure is the fit, and when do the first units fail?
A test-to-failure run ends with a column of numbers. Turning it into an answer takes the same steps every time, so I put them in one tool.
github.com/floraliu-dev/Test2Fail-Toolkit ↗ · Python · Ships with synthetic sample data only.
What it does
- Fits Weibull, Lognormal and Exponential by maximum likelihood and picks the best one.
- Checks the fit with a Kolmogorov–Smirnov test.
- Puts 95% bootstrap confidence intervals (1,000 resamples) on the Weibull β and η.
- Predicts B10, B50, B95 and MTTF from 10,000 Monte Carlo samples.
- Suggests a maintenance interval from a target reliability and cost.
- Writes every plot and table into one PDF.
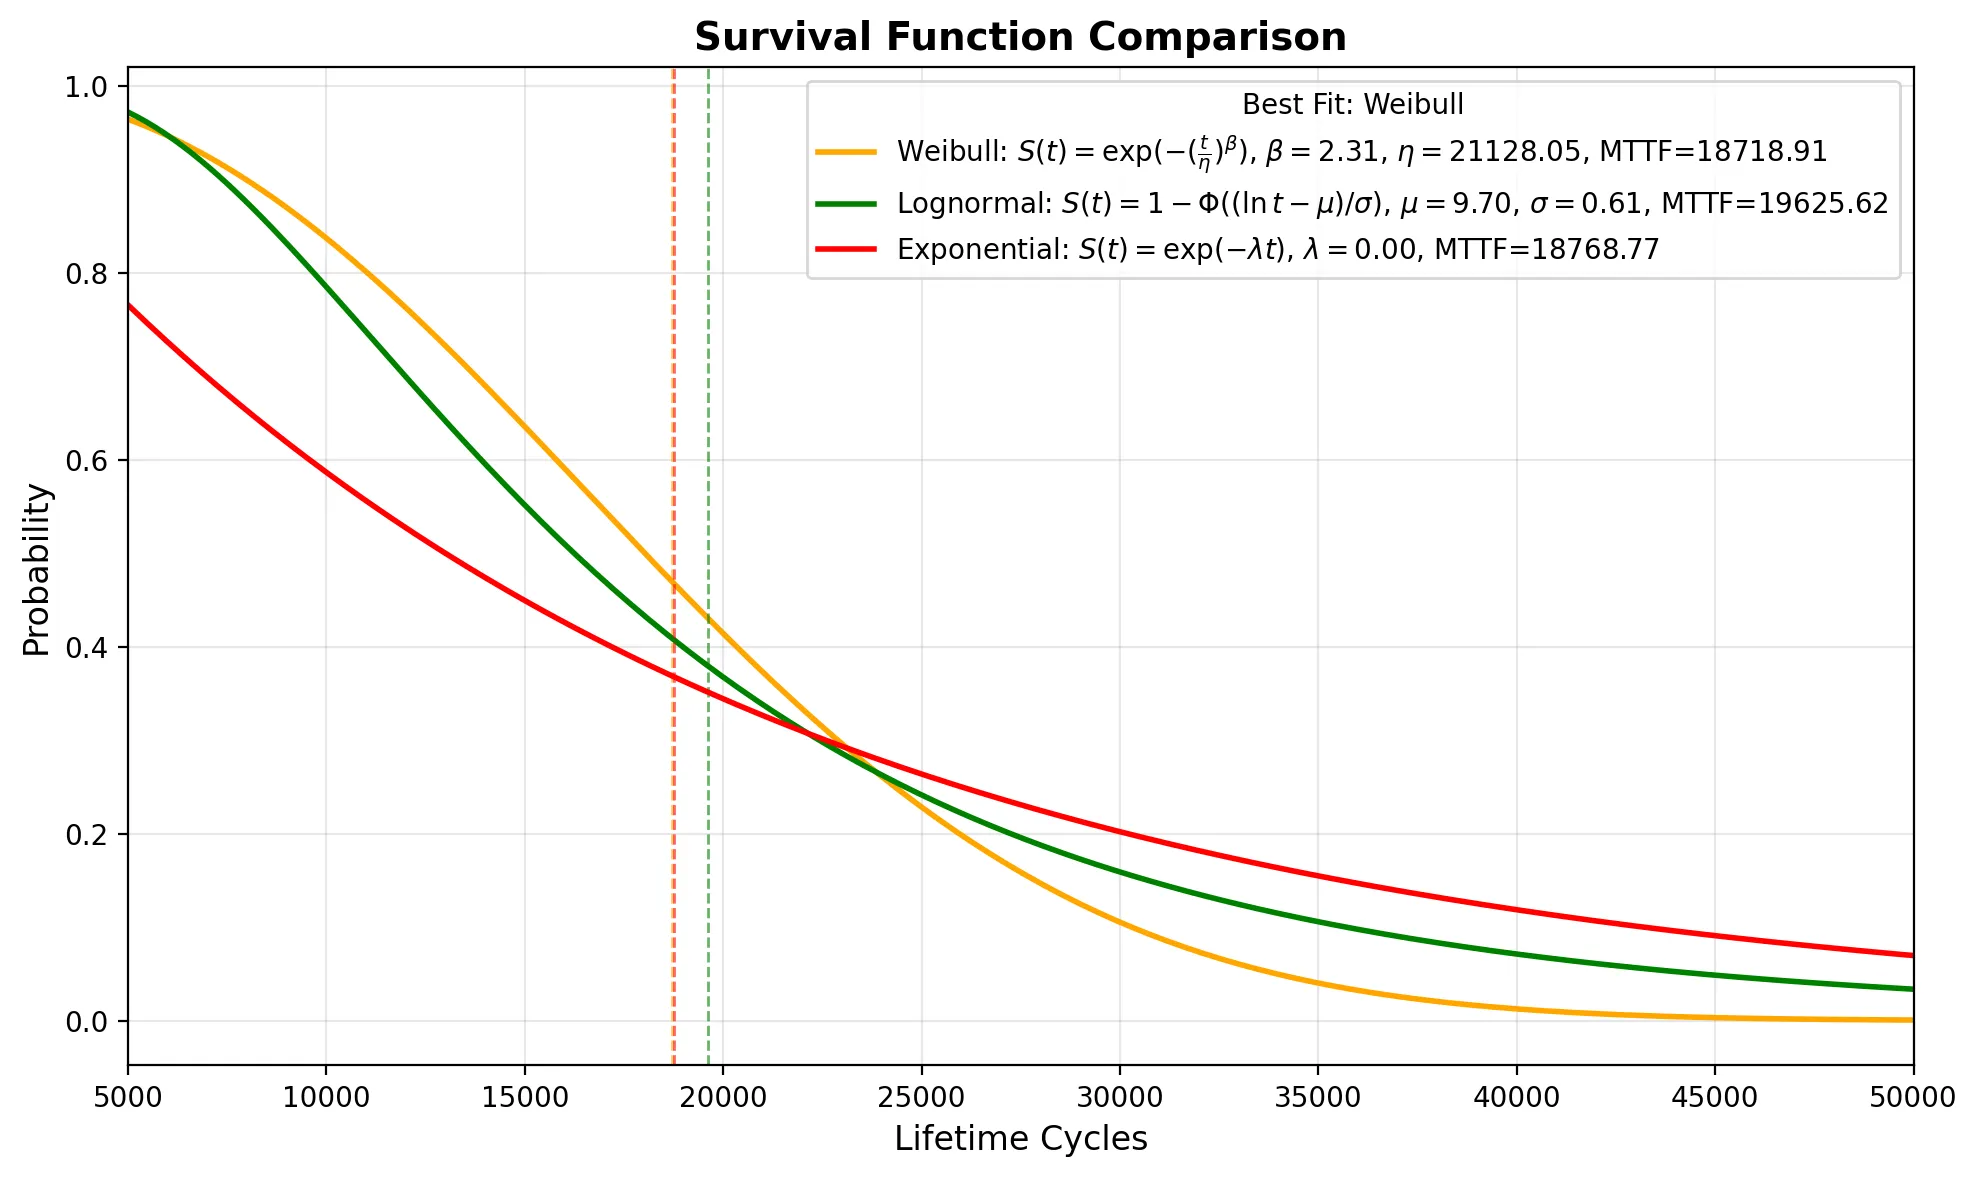
Why fit more than one model
Two models can agree on the mean life and still disagree on when the first 10% fail. Field returns come from that early tail, so the tool reports B10 and the fit test alongside MTTF.
I walk through one such dataset in How a product earns confidence.
Does the model match the data?
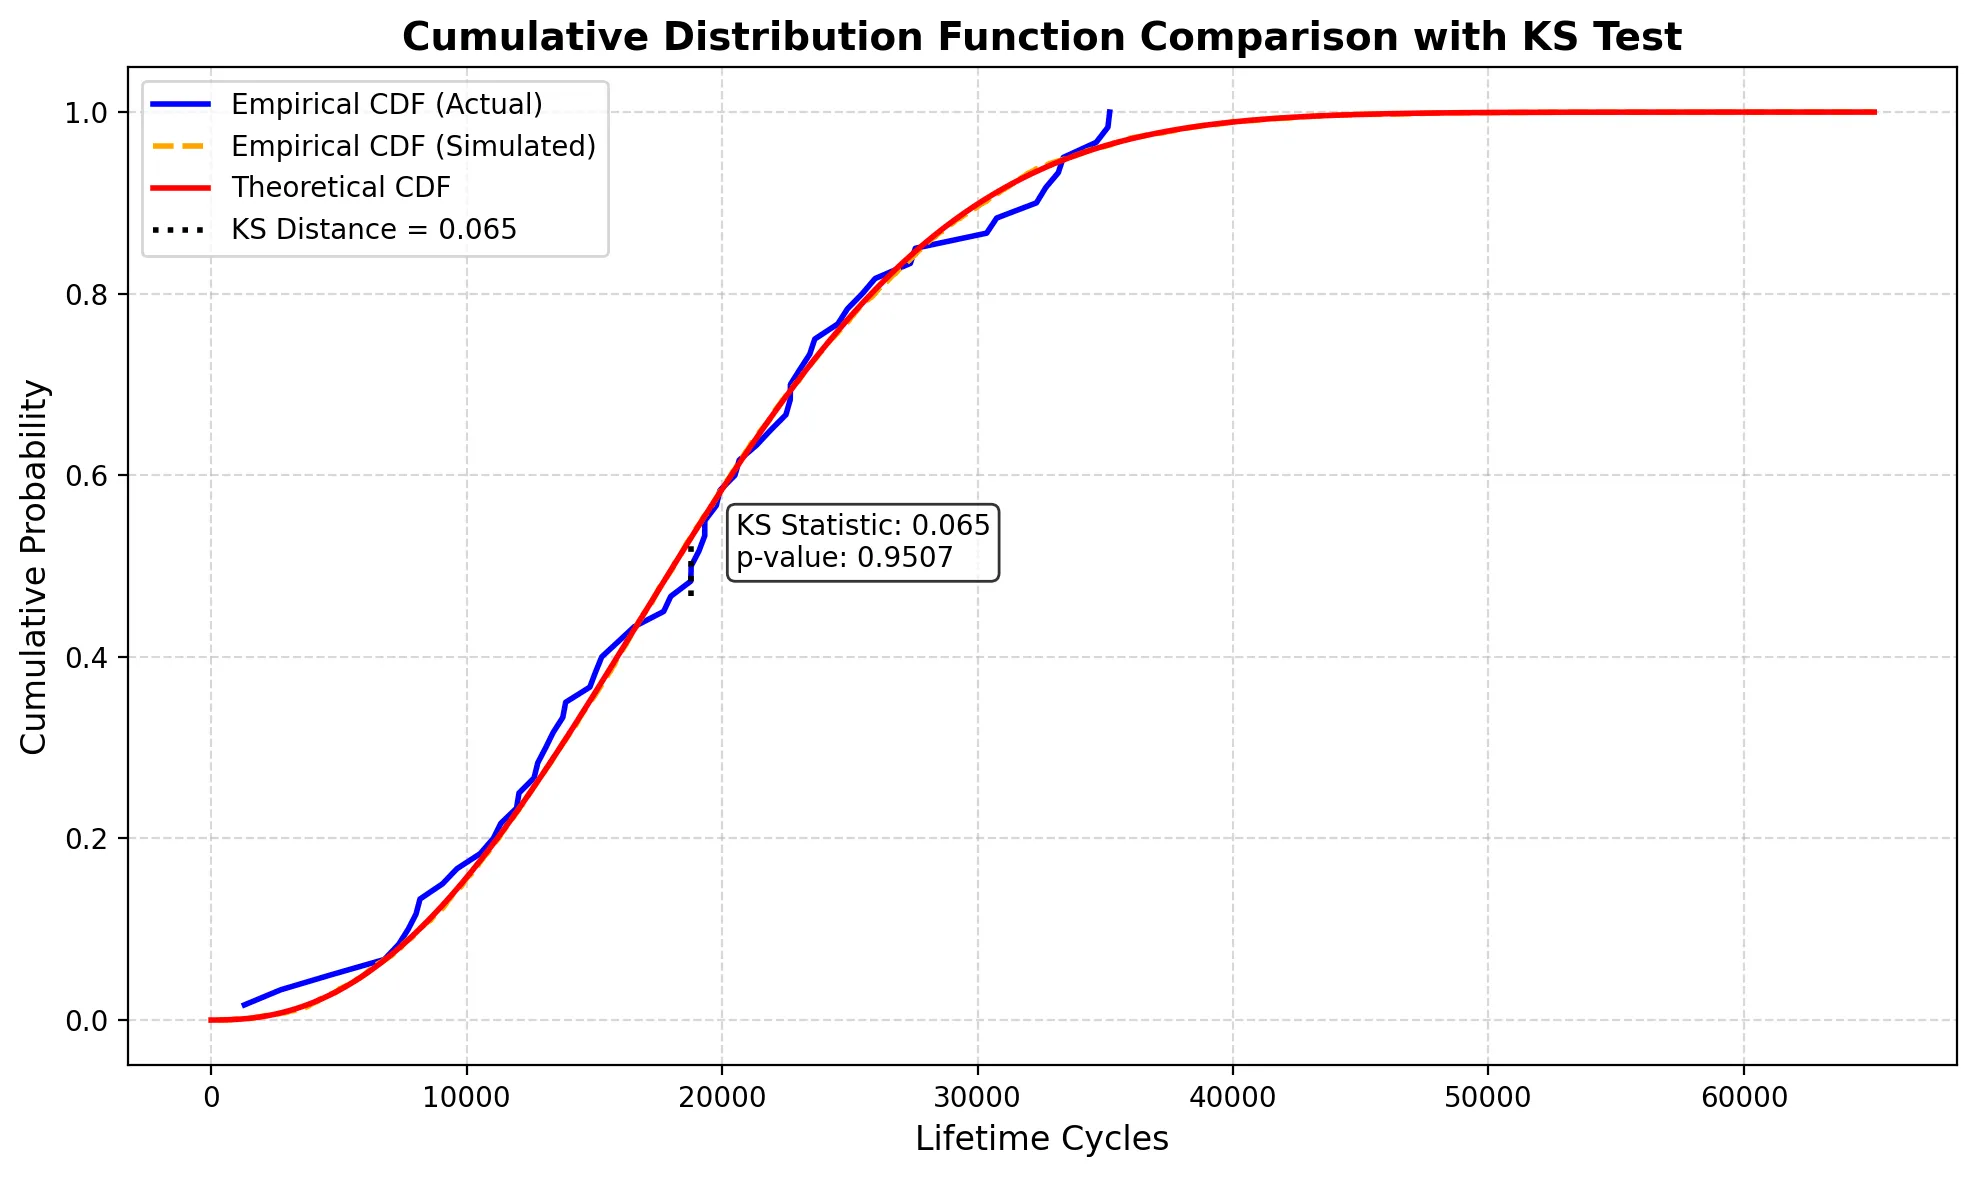
A best fit is only the best of three. The tool overlays the fitted CDF on the measured data and on a Monte Carlo sample drawn from the fit, then measures the largest gap between them.
Try it
- Download for Windows or macOS ↗, no Python needed.
- See a full sample report (PDF) ↗: every plot and table in one file.
-
Or run from source:
pip install -r requirements.txt, thenpython main.py. Sample datasets are indataset/.